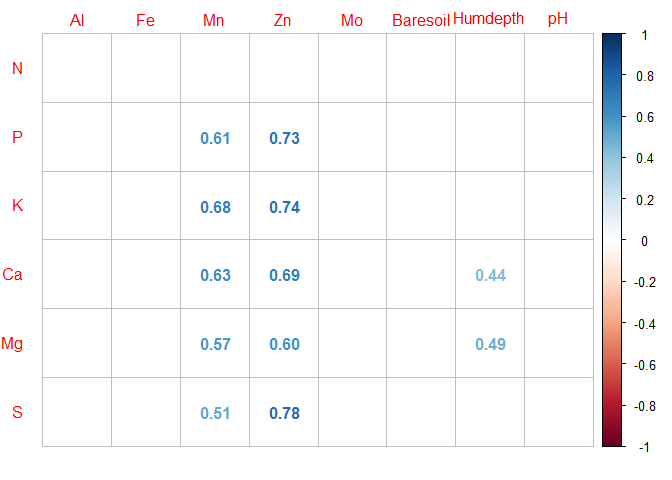
我需要计算一些特定变量(列)的相关性。
要计算特定列的相关性,我通过以下代码获得:
df<-read.csv("http://renatabrandt.github.io/EBC2015/data/varechem.csv", row.names=1)

cor_df<-(cor(df, method="spearman")[1:6, 7:14])%>%as.data.frame()
输出

但是,我希望 R 创建一个新矩阵,但仅具有显著性水平的相关性,其 p 值 <0.05,仅适用于集合[1:6, 7:14],也就是说排除那些不显著的(p 值 >0.05)
我希望不重要的被洗掉,或者用 NA 填充,或者一个只有能指的新 data.frame。
我的期望是:

uj5u.com热心网友回复:
请使用Hmisc,corrplot和dplyr库在下面找到一种可能的解决方案
正品
- 使用库
rcorr()函式计算相关系数和相应的 pvaluesHmisc
library(Hmisc)
library(corrplot)
library(dplyr)


coeffs <- rcorr(as.matrix(df), type="spearman")[[1]][1:6, 7:14]
coeffs
#>              Al         Fe          Mn          Zn           Mo   Baresoil
#> N  -0.151805133 -0.1295934 -0.01261144 -0.07526648  0.004643575 0.15481627
#> P  -0.001739509 -0.1200000  0.60782609  0.73423234  0.035371924 0.03043478
#> K   0.006089604 -0.1156773  0.67579910  0.74244074 -0.039359822 0.18264841
#> Ca -0.289628187 -0.3982609  0.63130435  0.68638545 -0.175533171 0.27739130
#> Mg -0.187866932 -0.2382609  0.57043478  0.60069601 -0.118938093 0.29739130
#> S   0.320574163  0.1117634  0.51402480  0.77789865  0.334337367 0.07784301
#>     Humdepth          pH
#> N  0.1307120 -0.07186484
#> P  0.2102302 -0.12114884
#> K  0.2963972 -0.31001388
#> Ca 0.4396914 -0.25114066
#> Mg 0.4912655 -0.33161178
#> S  0.1698382 -0.21448892


pvalues <- rcorr(as.matrix(df), type="spearman")[[3]][1:6, 7:14]
pvalues
#>           Al         Fe           Mn           Zn        Mo  Baresoil
#> N  0.4788771 0.54615126 0.9533606683 7.266830e-01 0.9828194 0.4700940
#> P  0.9935636 0.57648987 0.0016290786 4.418653e-05 0.8696630 0.8877339
#> K  0.9774704 0.59039698 0.0002896520 3.264276e-05 0.8551122 0.3929703
#> Ca 0.1698232 0.05391473 0.0009388912 2.126270e-04 0.4119734 0.1894124
#> Mg 0.3793530 0.26221751 0.0036070461 1.909894e-03 0.5798929 0.1581543
#> S  0.1266908 0.60311127 0.0101838168 7.669395e-06 0.1103062 0.7176938
#>      Humdepth        pH
#> N  0.54266218 0.7386046
#> P  0.32412825 0.5728181
#> K  0.15961613 0.1404062
#> Ca 0.03156073 0.2365150
#> Mg 0.01477451 0.1134202
#> S  0.42754109 0.3141949
- 使用
corrplot()函式进行可视化
r <- corrplot(coeffs,
              method = "number",
              p.mat = pvalues,
              sig.level = 0.05, # displays only corr. coeff. for p < 0.05
              insig = "blank",  # else leave the cell blank
              tl.srt = 0,       # control the orintation of text labels
              tl.offset = 1)    # control of the offset of the text labels

- 使用
corrplot()函式的结果构建更“传统”的结果矩阵
# Keep only the correlation coefficients for pvalues < 0.05
ResultsMatrix <- r$corrPos %>%
  mutate(corr = ifelse(p.value < 0.05, corr, NA))


# Set factors to control the order of rows and columns in the final cross-table
ResultsMatrix$xName <- factor(ResultsMatrix$xName,
                              levels = c("Al", "Fe", "Mn", "Zn", "Mo", "Baresoil", "Humdepth", "pH"))

ResultsMatrix$yName <- factor(ResultsMatrix$yName,
                              levels = c("N", "P", "K", "Ca", "Mg", "S"))

# Build the cross-table and get a dataframe as final result
xtabs(corr ~ yName   xName,
      data = ResultsMatrix,
      sparse = TRUE,
      addNA = TRUE) %>%
  as.matrix() %>%
  as.data.frame()
- 输出
#>    Al Fe        Mn        Zn Mo Baresoil  Humdepth pH
#> N  NA NA        NA        NA NA       NA        NA NA
#> P  NA NA 0.6078261 0.7342323 NA       NA        NA NA
#> K  NA NA 0.6757991 0.7424407 NA       NA        NA NA
#> Ca NA NA 0.6313043 0.6863854 NA       NA 0.4396914 NA
#> Mg NA NA 0.5704348 0.6006960 NA       NA 0.4912655 NA
#> S  NA NA 0.5140248 0.7778986 NA       NA        NA NA
由reprex 包(v2.0.1)于 2021 年 12 月 21 日创建


0 评论